The Problem
The ability to create a common graphical screen hierarchy and run-time features accessible by all users, such as linked trend groups and report selections, is time consuming, inefficient and difficult to manage.
The Solution
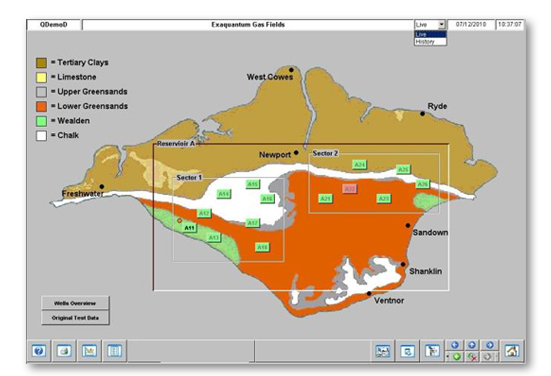
The Exaquantum/GF (GUI Framework) for Exaquantum provides common user access facilities across all Exaquantum/Explorer screens. These screens can be accessed by supervisors and managers needing to view the plant's processes. Screen interrelationships and linked features such as access to screen specific Microsoft Excel reports and trends provide in-depth access to key information. Screens are grouped within plant hierarchies to enable quick access to areas of concern with the ability to replay historical data.
Key Features
- The screen plant hierarchy is easy to configure and maintain
- Replay past plant incidents by using the History Replay facility within the currently displayed screen
- User access to pre-configured trends assigned to the currently displayed screen
- Each user can configure up to 16 personal trends accessible at any time from any Exaquantum/Explorer enabled PC
- User access to pre-configured Microsoft Excel reports assigned to the currently displayed screen
- Navigate directly to any graphic by selecting the required graphic from the hierarchal graphic list
- User efficiency is increased by being able to rapidly move between display screens via navigation buttons
- Drag & drop process data from the displayed screen and/or the Exaquantum Data Selector onto an always-on- top trend screen
- Ability to search for specific screens
- Ability to print the currently displayed screen
Looking for more information on our people, technology and solutions?
Contact Us