Carlos Ruiz, Oscar Santollani, Soteica Ideas & Technology LLC, Houston, TX
Introduction
CO2 emissions are in most part by-products of utility systems; therefore it is only logical to model emissions along with the energy system. Any attempt to reduce the costs from the utility side (i.e.. to optimize the energy system) should be based on the appropriate utility system models (calibrated with validated and consistent set of measurements) and a compositional fuel representation to allow combustion-based Carbon calculations. Solving and optimizing the energy and Carbon balances together is key to be consistent with operational and constraints handling.
The optimization's goal should be to reduce the overall utilities cost taking into account the constraints associated with the existing equipment, fuels/power pricing and contracts. The economic optimization should be done by considering the emission limits as constraints and/or part of the objective function (for example, cost or credit of the CO2 emission if above or below a certain quota). The energy management system models need to be executed and optimized at a scheduled frequency with online, real time data.
In addition to the optimization, Key Performance Indicators (KPIs) should also be calculated and stored in the Site Plant Information System or DCSs for Operations and Management use.
However, like in any other human activity, the technology by itself is not sufficient to guarantee the success of an energy and CO2 reduction initiative. Over a period of more than 20 years of deploying industrial projects related to energy systems real time optimization and cost reduction in refining and petrochemical industries around the world, the following or similar issues have been found:
- Many applications of energy cost and CO2 reduction technologies are successful when used offline by Engineers, at their offices, but only a few of them really succeed when transferred to the Operators to be routinely used in real time, tied to online field data, under unsupervised automatic execution.
- In some cases, systems that are deployed after successful, well engineered, real time projects and that are initially received enthusiastically by Engineers and Operators are only used for a few months after project completion and then fall in disuse.
- Real time systems with acceptable initial up-time figures end up degrading and finally are left offline, unused, after the Engineer in charge is promoted to a new position as a consequence of being so successful with them initially.
- Very well proven, sound technologies, fail when applied at a given Site while they succeed at a different location owned by the same Company.
- After a failure with one of those advanced technologies, the Site or the Company becomes "immunized" against similar technologies. Only after several years and with the renewal of the Engineering staff does the technology have a chance to be considered again.
This paper addresses some of the root causes for the above mentioned issues and discuss the best practices that will help to avoid project failures. Main project steps are explained and critical details to be taken into account to assure successful use and proper technology transfer are discussed. It also presents real industrial examples in which the whole utilities system cost of a production Site (i.e., steam, fuels, boiler feed water and electricity) is optimized with a real time, online, industrially well established software.
Real Time Energy Management Systems
Refineries and petrochemical plants usually operate large and complex utilities and energy systems. They burn several type of fuels, operate cogeneration units to supplement the electric power purchases or export electricity, need to provide several steam pressure levels to different types of consumers and observe emission limits.
In almost all of the cases, these complex utilities and energy systems have several degrees of freedom. Proper manipulation of the degrees of freedom with the aid of cost-based optimization software can result in significant operating cost savings. Since the electrical system represents one of the main economic trade-offs with the steam system and Site Carbon emission, electrical deregulation provides many new challenges to operate the overall combined energy system at minimum cost.
Other important aspects are that utilities systems are continuously evolving (changes are frequent) and that sometimes, there is a lack of sensors and often measurement errors need to be addressed properly.
In addition, utilities systems have several constraints that usually come from the operational and contractual sides. For example, minimum and maximum steam production capacity in the boilers, NOx / CO2 emission constraints, the need to maintain a steam production cushion due to safety reasons, or the fuels and electric power quotas and penalties.
Also, it is important to mention that traditionally, given the complexity of the systems, the optimization of the utilities was traditionally managed at the level of each individual Plant or Area. But the optimization of each individual Area does not necessarily give the true overall site optimum. Moreover, an attempt to optimize a whole site based on an isolated view of each Plant at a time could be worse than doing nothing.
In the dynamic operational and economical environment of a Plant, implementing the proper actions necessary for the optimum utilities system management can only be done with the aid of an on-line tool. It should execute in an unattended, automated way, providing at any
time the right answers to the different users (from operators to engineers), with the man- machine interface appropriate for each one of them.
To add more complexity to the problem, the environmental constraints are becoming more and more complex and stringent. In the US, CO2 emission reduction initiatives are a hot topic, like the State based emission reduction initiatives. For example, the California Climate Exchange Law AB-32, with a cap-and-trade scheme to be starting 2012 and the Regional Greenhouse Gas Initiative (RGGI), CO2 Budget, whose trading program was put in effect in 2009. In the near future it is expected to have a US cap-and-trade policy for emissions reduction to be modeled on the EU scheme, that aims to cut carbon emissions to 1990 levels by 2020 and 80% by 2050.
There is a clear move towards a global carbon market. Carbon markets grew more than 3 times their worth in 2006 and it is expected to do so again by 2015, according to the World Bank. Companies have clearly identified that Carbon is money in the current and future economy while emission reporting is becoming mandatory worldwide. With all the regulations already on place and those coming on the horizon, emissions will become a significant factor in operations and planning, adding new operational constraints, increasing the operating cost, involving potential needs of capital investment and generating value from trading. In the path to compliance, organizations are facing several challenges in establishing an effective procedure to deal with the emissions under a consistent, optimum base.
And to add even more burden to the problem, control rooms worldwide are facing a shortage of people. Operators are concentrating more and more on the Units under his/her responsibility. DCS screens flourished and hundreds or thousands of tags are available per Unit and a multitude of process diagrams and trends can be projected on the walls and even the ceilings. But only a few employees are available to take care of the overall energy system operability and economics. Industrial energy systems are becoming increasingly complex and inter-related, not only between Units of the same Site but also with the power and utilities systems of neighbor facilities.
The evolution from having plant information scattered throughout many islands of automation to a unified and centralized Plant Information System was a clear enabling layer for such work. DCSs (Distributed Control Systems (DCS) and Plant information (PI) systems are the most widely available data sources in the current industrial context. PI systems usually acquire data from the DCSs and store it in a unique repository. The long term, facility wide PI system based historians constitute what is known as an enabling technology, because they are the cornerstone on top of which decision support systems, such as energy management systems, can be built. Centralized real-time databases provide access to massive current and historical process, laboratory and financial data.
Energy Management System Software Description and Functionality
In order to successfully address all the issues mentioned above, a software tool called Visual MESA has been extensively used. The original MESA program was developed in the early 1980's. Since the Visual MESA version was released in 1997, it has been continuously improved and adapted to be able to cope with all these changing scenarios.
Visual MESA is a computer program designed to model steam, boiler feed water (BFW), condensate, fuel, emissions and electrical systems. It is an on-line program that receives live plant data from the steam, fuel, condensate, BFW, and electrical system metering devices via a standard link to the plant information system.
It typically works uninterruptedly retrieving on-line data from the process using the OPC standard connectivity, evaluating continuously the utilities and energy system optimization alternatives and writing key performance indicators back to the plant information system.
The software includes all the necessary features to calculate and handle emissions properly: compositional description of the fuels streams, combustion properties to calculate boilers and heaters efficiencies, emission source stoichiometric calculations or estimated based on correlations for individual process point sources (for example, FCC catalyst Carbon burnt at the regenerator), heaters and boilers, etc.
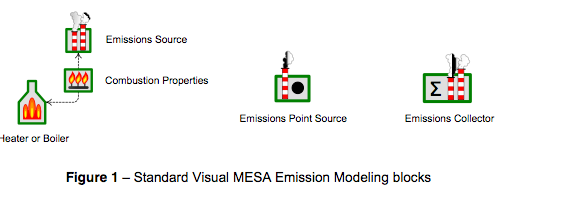
Main benefit sources from where high savings can usually be obtained are:
Optimization: It helps to find the most economical way to run the utilities and energy systems, while remaining within the real operating constraints. It enables plant personnel to:
- Understand how to improve the optimum steam/fuels/electrical system operation, including emission constraints and costs.
- Quick reaction to minimize the economical impact of an operational change.
- Optimize the overall cost of fuel for steam generation and electricity, including the choice of the most convenient combination of turbines and motors.
- Make a good use of the utilities network data availability and improve its quality.
Monitoring: It provides a number of monitoring features that help access data, control data quality, and alert about changes to the system, like:
- Plant, equipments and streams information
- Trending data and calculation results
· Big changes on utilities streams and emissions regulations compliance alerts
· Data quality (balloons, graphically representing header mass balance imbalances)
Case Studies ("What If?" Planning): It allows performing and evaluating "What If?" cases that enable plant personnel to find ways to operate more efficiently and at less cost. Some examples are:
- Front-end loading on projects
- True "Plant-wide" project evaluation
- Steam, fuel, BFW, condensate, and electrical system improvements
- CO2 emissions mitigation projects, credits availability and/or new constraints
Auditing & Accounting: It helps plant personnel to find where steam waste is occurring in the steam system, provides information to account for it properly and identifies where the imbalances are and how they behave in time.
This on-line energy management system was implemented in around 40 sites worldwide to model and optimize the overall site energy and utilities systems for a variety of industries: petrochemical, refining, chemical, sugar & alcohol, district heating and cooling, combined heat and power, etc. Several of them have been published (Refs. 4 to 17 are related to recent industrial projects). Amongst them, two particular examples will be presented and discussed.
Industrial Project Examples
The following two industrial projects are presented as examples:
- Medium size refinery complex
- Example of daily recommendations and their impact on CO2 emission
- Complex refinery with high conversion Units
- Fuel gas network management and integration with the rest of the utilities system
Medium size refinery complex
This industrial example corresponds to TOTAL Feyzin refinery (Refs. 9 and 10). TOTAL is a leading refiner-marketer operating 11 refineries directly in Western Europe and one refinery in the U.S. at Port Arthur, TX. The reduction of greenhouse emissions and the enhancement of energy efficiency are among the current Company corporate challenges.
In this example, a set of manual operating recommendations given by the optimizer during a particular shift have been:
- Pump swaps (i.e., steam turbine and motors driving pumps that can be used interchangeably)
- Fuels to boilers, such as Fuel Gas (FG) and Fuel Oil (FO)
- Power production in steam turbine generators
As a result of the manual actions, adjustments to the following variables have been made by the control system:
- Steam production from boilers
- Letdown and vent rates
The following figures show the impact on steam production, fuel use and CO2 emissions reduction:
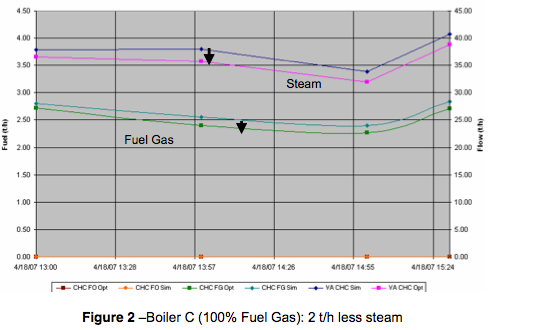
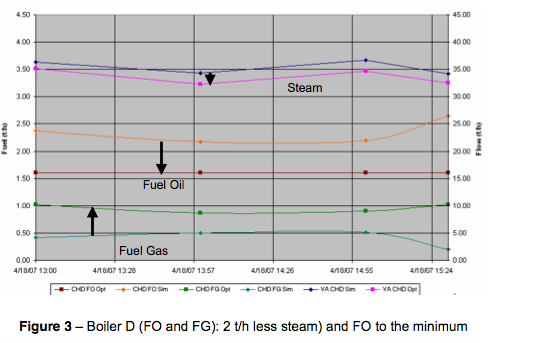
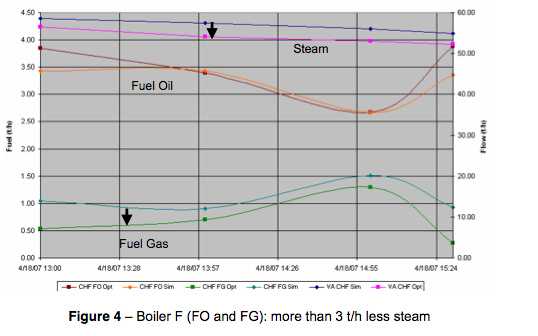
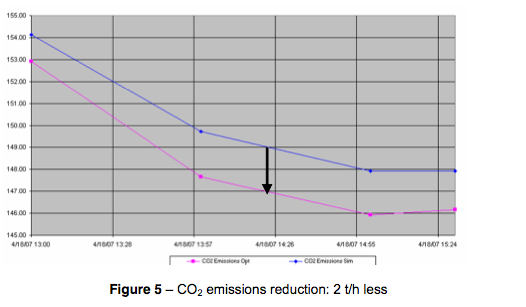
In summary, the following changes were achieved while optimizing the overall cost:
- Almost 1 t/h less of FO consumed
- Approx. 7 t/h less of high pressure steam produced
- Approx. 2 t/h less of CO2 emitted
- Approx. 200 kW more of electricity imported
When considering the CO2 emission cost, the following is an example of the recommendation for operators:
As a result of the manual change in the boiler fuel use (more FG and less FO in overall), the Fuel Gas header pressure control system made the necessary adjustments which resulted in the need to increase the incremental Natural Gas import.
The following figure shows the fuel gas network model representation highlighting the differences between current and optimized situation (delta view, duty flows).
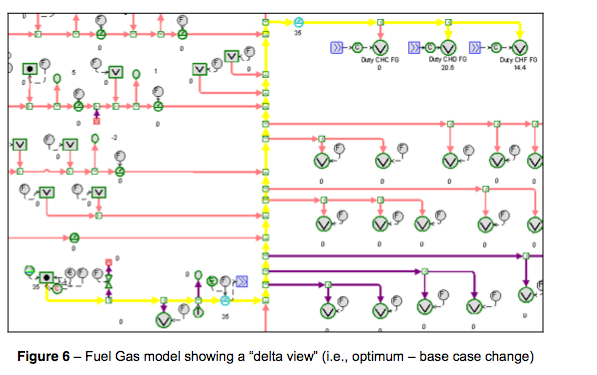
On the left, fuel gas suppliers are represented, while on the right Fuel Gas consumers are displayed. The values indicate the corresponding changes, expressed in MW, after the application of the recommendations (zero value means no change).
As a result of replacing FO by FG (with the need to import more Natural Gas) and improving the steam efficiency usage by reducing let-downs and vents, CO2 emissions are reduced by 4.7 t/h. This is important to consider when a trade-off between cheaper fuels that produce more CO2 and more expensive fuels that produce less CO2 exist. It would be an especially important consideration when the CO2 emissions quota is expected to be exceeded by the end of the year.
Complex refinery with high conversion Units
At the Petronor site, Spain's largest refinery (ref. 1) with a processing capacity of eleven million tons of crude oil per year, a Visual MESA based on-line model for energy management has been implemented. Its energy system is large and complex; therefore, the auditing and control of energy costs are a real challenge.
The full model of the energy system includes the entire fuel, steam, boiler feed water, condensate and power systems. Steam is generated in several places, with both conventional boilers, heat recovery steam generators and a cogeneration unit with steam injection. Electricity and fuel supply contract details have been included in the model. In particular, the purchased Natural Gas daily quota was rigorously modeled and the constraints respected during the routine optimization.
All the constraints have been included and the model is continually populated with live, validated data. Performance monitoring is performed and includes the follow up of calculated equipment efficiencies using the validated data mentioned before as well as the site Carbon emissions.
By auditing the energy system, imbalances are detected and diagnosed. As a result, the data can be relied on for evaluating the value of energy production and usage, and waste can be eliminated. Planning for a better operation of the energy system by performing case studies is usually done by using the validated model in off-line mode. Finally, it is important to mention that the optimization of operating conditions is performed on a continuous, daily basis since the system was commissioned in 2005. As a result of the project, substantial savings in energy costs have been achieved.
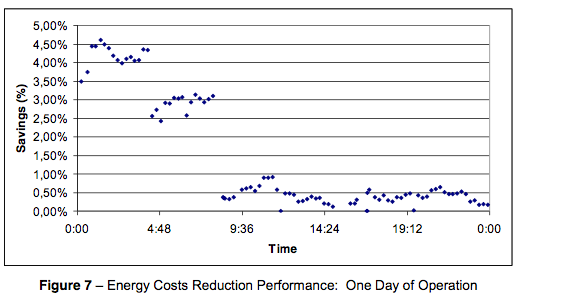
In order to illustrate the obtained benefits, optimization results are shown in Figure 7. Results correspond to one day of operation using Visual MESA. Savings are indicated as a percentage of total energy costs. After implementing the optimization recommendations, operation is closer to the minimum global energy cost, as it can be seen in the plot, after 9:36 AM. When the operator saw in the report potential savings higher than 1% of the overall utilities system cost, he implemented the optimization recommendations (in this case, a combination of changes in boiler loads and steam flows among production areas).
Real Time Energy Management System Projects Key Issues
To successfully implement, deploy and sustain a real time energy management system energy cost and CO2 emission reduction project, there are several issues that need to be addressed and recommended practices we have found useful to be taken into account.
Proper Technology Selection: Select the technology that fits with the problem solution rather than force the problem to be solved with an a priori selected technology. For example, if a simple linear regression with two input variables is sufficient enough to infer the NOx emission, do not force the use of a several inputs neural network. But always high rank systems based on sound process engineering principles (i.e., mass and energy balances and rigorous non-linear equipment modeling) than those based on correlations or non-physical sense solutions (Friedman, 1999).
Avoid "Computerization": To solve a given problem, engineers need to apply the EBC approach suggested by Richalet, 2000, rather than the straight use of C. Follow the EBC procedure implies:
- First, use your Eye to inspect trends, data, process diagrams, DCS screens...
- Second, use your Brain to carefully understand and design the real time system and select or design the proper software tool.
- Finally, only at the end, use the Computer to solve the problem. The enthusiastic but inexperienced engineers tend to go straight to the Computer, forgetting or minimizing to analyze and perfectly understand the problem to be solved, their real handles and constraints.
Balance Model Complexity against Expected Results: Energy system model complexity must be balanced against expected benefits. Remember the golden rule: "the simplest is generally the better". Engineering judgment and experience plays a key role in this task. Operators and Engineers will appreciate any efforts towards simplification, especially for future re-training and system maintenance.
Real Time Data Seldom Can be Used "as is": Carefully designed and engineered "safety envelops" must be built around real time on-line data, in order to validate all the signals, in and out of the applications. Minimum and maximum limits for each variable, controller windup identification and associated valve openings and controllers statuses must be combined to properly identify and isolate measurement problems. Steady state detection procedures must also be considered to warn Operators or directly skip an optimization run if the Process is unstable. What should a system do if bad data is detected? If the bad data feeds "critical" variables of the system, then its execution should be suspended and Operators warned. If bad data is related to "noncritical" variables then some kind of backup or default values could be used but such an action needs to be defined on each individual variable. The implementation of data validation procedures is a key activity for every real time energy management system project.
Pricing Information Must be Properly Updated: As economics is the main driver to apply real time energy management systems, prices used for the optimization or objective function calculations must be diligently updated. Manual data entering should be avoided.
Automatic pricing information must be implemented acquiring the prices directly from process information systems or web pages (some examples we have used in the past include the web sites of ERCOT in Texas, US, OMEL in Spain, both for electricity market spot prices and ICE in the US for energy prices).
Have Operators Always in Mind: From the very beginning try to involve Operators, inform them about the project objectives and solve their concerns. A common question is about being replaced by the new system and fired after completion. Second in rank is their worries regarding if the new system will increase their burden. First question is usually outside our control but we never have seen a single Operator being fired due to our projects, all of them successful, by the way. With respect to the second concern, an especial effort needs to be done to not increase Operator's burden, implementing automatic data updates or procedures to minimize his/her manual intervention. Clear and easy to understand operating interfaces need also to be built. Operators must be properly trained and assisted right by the DCS console after being left alone with the new system. It is always a good idea to spend many hours at the DCS console with the Operators to discuss the proposed solutions and technology, explaining to them what is needed so they will accept the introduction of the new technology. Properly designed Operating manuals must be provided and updated as frequently as needed.
Do not "Prototype" but Deploy Well Engineered Systems: Do not expose Operators nor final users to "interim or prototyping versions" but only to finished, very well built models, including the Operating interface and true handles limits and constraints. Operator's general attitude is to closely adhere to their first impression. There is a single "silver bullet" to use with them: they will never forget if early disappointed or frustrated when trying to use the system for the first time. Moreover, many of them would became "vaccinated" against the energy management technology and refuse to use it, subtle or frontally.
Sustain the Application to be Maintained "Forever Green": Engineering documentation must be provided and updated as soon as changes are implemented in the model or to the Operating interface. The application needs to be maintained "forever green", reflecting continuously the current Process handles and constraints. Changes on the energy system or process related side must be immediately reflected in the model. Local resources need to be properly trained and technology providers need to assist them and remotely maintain the applications. As a side note, it is important to mention the huge impact of remote access capabilities on systems performance. Only a few years ago just a minor model adjustment would take a lot of time for the new information to be exchanged back and forth. Nowadays, VPN or Webex like secure remote access can be easily implemented and solutions can be provided in minutes, instead of hours or even days.
Conclusions
CO2 emissions and energy cost reductions have been obtained taking advantage of an energy management system software functionalities. It demonstrated to be a robust optimizer and very well suited to be used on-line, providing optimization recommendations to the operators on a routine basis.
The authors, working tightly with clients and Soteica engineering team members, following the generic outlined project rules, have participated in many successful implementations which resulted in significant economic benefits for the refining and petrochemical industries involved.
The success ratio of the industrial real time project deployments was highly increased by following a set of simple rules and ensuring a proper knowledge transfer to both, Operators and Engineers. Coordination among plant areas in order to implement the proposed optimization recommendations, as well as management involvement, were critical issues. The robustness of the tool helped Operators to gain confidence on the overall optimization system.
Application sustainability, which includes both maintenance and support, helps to sustain the economic benefits after commissioning allowing them to be always in good shape and still used and appreciated by the owners many years after handing the project over to them.
References
OPC Foundation, http://www.opcfoundation.org/, 2010
"Avoid Advanced Control Project Mistakes",Y.Z.Friedman,ChapterofthebookAdvanced Process Control and Information Systems for the Process Industries, L. Kane (editor) , ISBN 0-88415-239-1, Gulf Publishing Co., Houston, Texas, Pages 42-48, 1999
Personal communication, J. Richalet, 2000
"Auditing and control of energy costs in a large refinery by using an on line tool", D. Ruiz, C. Ruiz, J. Mamprin, Depto. de Energías y Efluentes Petronor, (2005), ERTC Asset Maximisation Conference organized by Global Technology Forum, Budapest, May 23-25, 2005
"Reducing refinery energy costs", Ruiz D., Ruiz C., Nelson D., Roseme G., Lázaro M. and Sartaguda M., (2006), Petroleum Technology Quarterly, pages 103-105, Q1 2006
"Online energy management", S. Benedicto, B. Garrote, D. Ruiz, J. Mamprin and C. Ruiz, Petroleum Technology Quarterly, pages 131-138, Q1 2007
"The Use of an On-line model for Energy Site-Wide Costs Minimisation", García Casas, J.M., Kihn, M., Ruiz D. and Ruiz C., (2007), ERTC Asset Maximisation Conference organized by Global Technology Forum, May 21-23, Rome, 2007
"Energy System Real Time Optimization", D. Uztürk, H. D. Franklin, J. M. Righi, A. T. Georgiou, NPRA Plant Automation and Decision Support Conference, Phoenix, USA, 2006
9. "Site-wideEnergyCostsReductionatTOTALFeyzinRefinery",DépartementProcédés- Energie, Logistique, Utilités, TOTAL - Raffinerie de Feyzin, D. Ruiz, J. Mamprin and C. Ruiz, ERTC 12th Annual Meeting organized by Global Technology Forum, 19-21 November, Barcelona, 2007
10."A Watchdog System for Energy Efficiency and CO2 Emissions Reduction", Diego Ruiz, Carlos A. Ruiz, European Refining Technology Conference (ERTC) Sustainable Refining, Brussels, Belgium, April 2008
11."Online energy costs optimizer at petrochemical plant", Marcos Kihn, Diego Ruiz, Carlos Ruiz, Antonio García Nogales, Hydrocarbon Engineering, pages 119-123, May 2008
12."Finding Benefits by Modeling and Optimizing Steam and Power Systems", M. Reid, C. Harper, C. Hayes, Industrial Energy Technology Conference (IETC), New Orleans, May 2008
13."Energy Real-Time Optimizer Baytown Refining/Chemical Complex", M. Lorenz, Industrial Energy Technology Conference (IETC), New Orleans, May 2009
14."Real Time Energy Management at Repsol Cartagena Refinery", Fernán Serralunga, Diego Ruiz, Carlos Ruiz, Process Department REPSOL Cartagena Refinery, European Refining Technology Conference (ERTC) Asset Maximisation, Prague, May 2009
15."Industrial Experience on the Implementation of Real Time On Line Energy Management Systems in Sugar and Alcohol Industry", Douglas C. Mariani, Marcos A. Kihn, Carlos A. Ruiz, 10th International Symposium on Process Systems Engineering - PSE2009, Salvador de Bahia, Brazil, Elsevier, August 2009
16."Emissions and Energy: An Integral Approach Using an On-Line Energy Management and Optimization Mode"l, Diego Ruiz, Fernán Serralunga, Carlos Ruiz, European Refining Technology Conference (ERTC) Annual Meeting Energy Workshop, Berlin, Germany, November 2009
17."Online real-time optimisation helps identify energy gaps", Marcelo Galleguillos, Michel Maffet, Marcos Kihn, Ruben Monje and Carlos Ruiz. Petroleum Technology Quarterly (PTQ), Q4, 101-109, October 2010